“Are you more of an artist or a scientist?” This is a highly topical question but the truth is that even though science and art are often regarded as distinct, many researchers produce art at different levels and through different channels.
Data-driven science and emotion-driven art can seem like polar opposites to some, or at least as disciplines with little in common. I say seem, as nothing could be further from the truth. Science and art can intersect in many ways, both professionally and casually. As it is the case of a well-renowned science and engineer also noted for his Mona Lisa painting, being one of the leading artists of the High Renaissance: Leonardo da Vinci, who is a perfect representative of this. His Vitruvian Man (L’Uomo Vitruviano), to take another example, graphically materializes the beauty, complexity, and symmetry of the human frame.
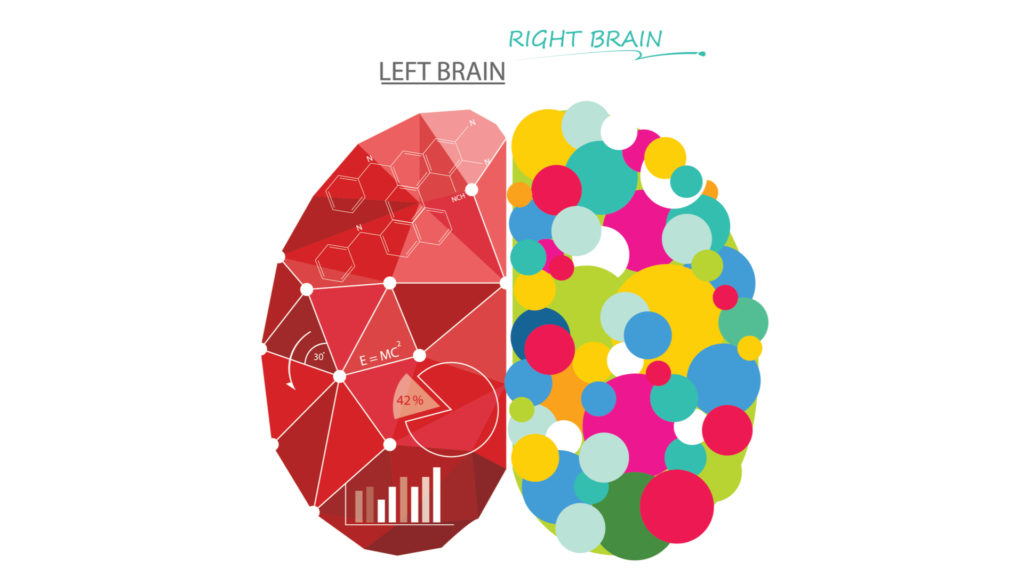
Back to the present, according to a recent study published in the journal Communications biology, graphics are becoming increasingly important for scientists to effectively communicate their findings to broad audiences. This is hardly surprising in view of the fact that we often think of significant breakthroughs and discoveries in visual terms: the DNA double helix or Darwin’s sketches of the tree of life, for example. “The power of these pictures to speak to people, especially those outside our specialized research communities, is worth far more than a thousand words,” as stated by the authors.
Taking into account the fact that online viewers decide whether to engage with the material within a matter of seconds, compelling visuals are pivotal. Thus, nowadays scientists’ need for visual art is clear. “Well-constructed graphics can widen the impact of research articles striving to be noticed in an ever-increasing flood of published work, and supplementary visuals, for instance, graphical abstracts, are often now requested by journals,” according to the authors.
However, most researchers lack expertise in visual media. To address these, the authors tested the efficacy of scientists–graphic artist collaborations by pairing six research laboratories involved in different aspects of biological and agricultural sciences with graphic designers and media content creators. The scientist–artist pairs were asked to create infographics–visually arresting, quickly understandable, graphical representations of scientific research– based on the research laboratories’ current projects, within three months.
While collaborating, authors saw how a number of the participating researchers were surprised to find that the act of translating their work into an infographic pushed their science forward: “They agonized over the challenge of distilling complex concepts into clear, focused, and accessible messages, but the process helped them to identify the central components of their work and to note areas that they had not studied sufficiently.” Furthermore, this process forced the researchers to reflect on, and then communicate, why they do what they do, as well as how their work impacts society.
These are all needed steps to increase the attractiveness, understandability, and communication power of scientists’ research findings and graphics have the potential to achieve it. “They can help science reach audiences that research literature never will”, concludes the study referring to the general public.
Nowadays, while many researchers actively communicate their work via social media and other formats beyond their traditional channels, very few have expertise in visual media communications for online platforms. “Learning the specialized skills needed to create graphics for the changing array of conventional and new science media is a very big task,” stress the authors.
But, it is really worthwhile and scientists are not expected to go it alone, they already have a great amount of work to do: designing, undertaking and analysing information from controlled laboratory-based investigations, experiments and trials, sharing their work with peers in various forms, including papers published in a scientific journal (being the most demanding forms) and presentations at conferences and congresses; to take just a few examples. So, how to get to everything? Authors suggest collaborations between researchers, graphic designers, and other visual communications professionals that can offer great potential.
Meanwhile, as long as scientists keep learning daily, they can also find some free tools as https://mindthegraph.com/, a simple infographic tool for medical doctors and scientists, or https://www.visme.co/ where they can find high-quality scientific infographic templates that will allow them to put on the best presentation possible for their audience.

Leave a message